

Ever go to the grocery store, fill up your shopping cart with delicious items, and then decide to just ... walk away? How about scanning items in the checkout line only to say "nah" and simply ditch the whole enterprise?
Of course, you haven't.
Yet, those two actions, cart abandonment and checkout abandonment, occur millions of times each day for online retailers across the globe. According to a global study by Baymad, 69 percent of shoppers walk away from their carts. Of the customers who stick around to the checkout line, 41 percent will abandon their checkout.
That's a lot of wasted effort -- and ad dollars -- walking out the door.
Let's cover how to measure and improve cart and checkout abandonment, or as I refer to it, "cartalytics."
How To Measure Cart and Checkout Abandonment
Before you can improve abandonment rates, start with some baseline data. Let's define the two main metrics we're looking to improve:
1. The cart abandonment rate is calculated with the formula: added to cart/(added to cart+purchases). It represents the percentage of customers who abandoned cart items out of all the customers who added items to their carts.
For example, if 100 people added items to their carts but only 25 of them converted, the cart abandonment rate is: 100/(100+25)=0.8=80 percent. Therefore, 80 percent of customers who added items to their carts have abandoned them.
2. The checkout abandonment rate is similar and calculated with the formula: started checkout page / (started checkout page +completed purchases). It represents the percentage of customers who abandoned checkout items out of all the customers who added items to their carts.
Luckily, Google Analytics includes this data for any advanced e-commerce setup. To begin, open the Conversions and Shopping Behavior section within Google Analytics. You should see a report for the stages of your customer's on-site journey for the selected time period. As you view the chart from left to right, you should see how many visitors dropped out at various stages of the customer journey.
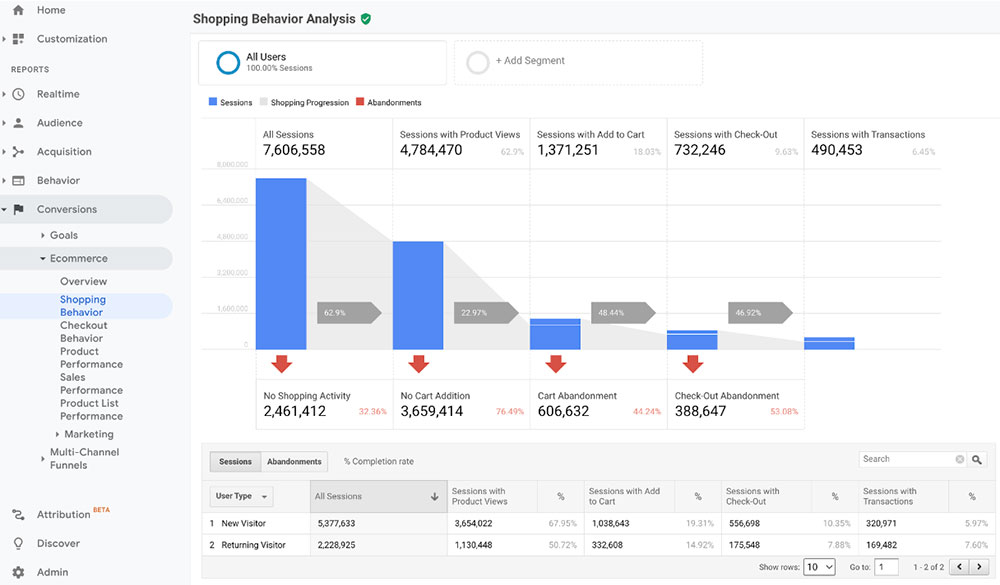
These two metrics are critical to record over time. As you implement abandonment-recovery strategies, keep an eye on the changes to this view over time (at least twice a month).
How To Improve Cart and Checkout Abandonment
The first thing to keep in mind is nobody arrives at your website accidentally -- and everybody arrives with some level of buying intent. When looking at the two abandonment rates, follow these three rules: engage the customer, keep it simple (and fast!) and don't sell past the close.
Cart Abandonment
Window Shoppers
A large portion of cart abandonment is driven by window shoppers. These customers are using the cart to store "future purchase intent." A good way to measure this is to look at cart abandonment rates for returning users. Often, a higher rate for this customer segment points to browsing and a lack of immediacy in the buying process.
Combatting this behavior is tough, but an alternative method is to engage the customer and help convert "in active carts" into active wish lists.
For example, when a customer is about to leave the site -- a simple pop-up offering to save their cart if they enter their email address gives you an opportunity to re-engage later. With an email in hand, you can employ traditional re-engagement methods that introduce time-induced FOMO (e.g., items selling out fast emails or sale ending tomorrow) messages.
In short, embrace the browse and engage the customer to return later.
Friction
Simple friction is a second major source of cart abandonment. When a customer has added an item to cart, the path to checkout should be as short as possible. Amazon excels at this with its simple one-click, buy-now button, but retailers can employ other even simpler methods.
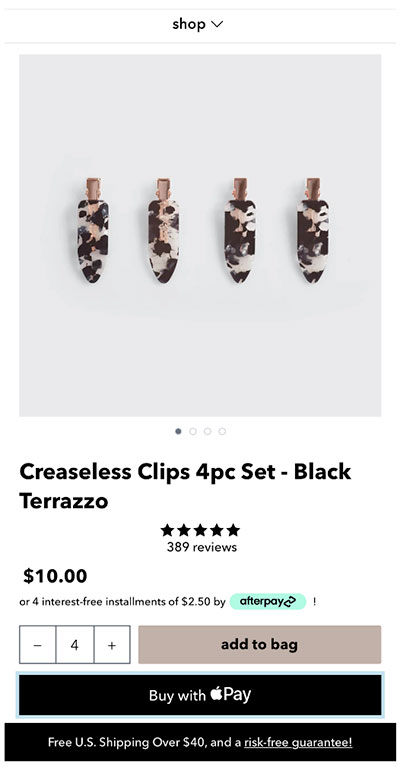
For mobile customers on iOS (a device category where retargeting is complex), the Apple Pay system provides a fast checkout experience. In the example below from an online retailer, the Apple Pay button helps drive users past the cart and directly to checkout -- with zero friction.
Friction can also be introduced by attempting to "over-sell" the cart. Adding upsells and introducing too many tracking events on cart actions can dramatically impact page speed.
Site speed continues to be a leading cause of decreased conversion rates, with slower sites experiencing dramatic reductions in conversions, average order value and even brand loyalty.
A recent study by Radware found that one in five customers will abandon carts solely due to slow site performance.
In short -- the best cart is often one that the user skips entirely, and this keeps your experience fast and friction-free.
Checkout Abandonment
When it comes to checkout, the experience should be unsurprising, frictionless, and most importantly, fast.
Let's face it, nobody likes surprises when it comes to unexpected costs. Be upfront with your customer and give them all the information they need before checking out. For example, providing shipping costs earlier in the journey is one way to boost transparence. If you don't, they'll feel scammed or tricked and may turn to your competitors for a better deal.
Along the same lines, evaluating when shipping costs can be eliminated is now a key component to a successful checkout. The ideal consumer cost is $0 (thanks, Amazon!) but most customers are willing to invest in more products to reach free shipping. In fact, 90 percent of customers said they would take significant actions to qualify for free shipping, including 58 percent who said they would add more items to their cart in order to qualify.
Retailers often view the checkout process as an opportunity to upsell additional products, and there is some merit to this -- but in moderation. When a customer reaches checkout, take a moment to analyze if introducing extra products is right for this customer.
For customers who have a single item in their cart and a short session time, especially on mobile, keep it simple -- and fast. By comparison, customers who arrive at checkout with more complex carts and have displayed a longer engagement time are more open to upsell opportunities -- especially if they unlock cost reductions like free shipping.
But the key aspect with checkout is to keep the entire process as simple as possible. According to research by the Baymard Institute, the average checkout flow has 5.08 steps. Aim for a checkout flow that hits well below 5 steps, and you'll stand out among your competitors.
Now you're well equipped to better understand cart and checkout abandonment, how to measure it -- and most importantly, and how you can improve your online store's checkout experience overall.


Social Media
See all Social Media